Operating layer Capture
Capture · case studies
What capture found, and what changed because of it.
Capture is the first step: a business’s flows, task types and schema, learned from the people who do the work. Three engagements where that knowledge was in people’s heads and had to come out quickly: a restructure across geographies, a commercialization process nobody had documented, and a retirement cliff at a government agency.
Delivered with Sugarwork, now part of Decidr. The results are the clients’ own, as they reported them, and each case says what it does not show.

Moving a hundred engineers’ knowledge between continents, in six weeks.
Appen, the ASX-listed AI data company, was restructuring engineering from one geography to another across machine learning, DevOps, data science and quality assurance. Earlier knowledge-sharing efforts had been manual and had not stuck. The business had to keep running while it happened.
The goal it served
Every departing role handed over to a paired learner within six weeks, with client delivery held throughout.
What was done
Leaders paired experts with learners by role and domain. Each pair worked through expert-built question sets on roles, responsibilities and technical architecture in recorded conversations on Microsoft Teams. Over six weeks the pairs held more than 250 sessions. Each one was captured, transcribed and summarized, and leaders could see which topics were covered and switch pairs where they were not.
What people got
New engineers arrived to an onboarding guide generated from the captured conversations and a conversational interface over the same material, so questions went to the knowledge rather than to the person who used to hold it.
Results
Figures as reported by Appen.
“It played a pivotal role in reducing onboarding time by 70% through the sharing of knowledge across a global team of 100 engineers in a matter of weeks. It enabled us to bridge geographical gaps and get to deep, tribal knowledge even in areas we had not had visibility over.”
Mo Chahdi, Global Vice President, Employee Experience, Appen
“It allowed our employees to deepen relationships both within their current teams and across functional areas during a period of transformational change.”
Andrea Clayton, Chief People Officer, Appen
What this does not show
Capture moved knowledge, not work. The engineers still do every task they did before; what changed is how quickly a newcomer could do them. The 70% is onboarding time, not delivery cost. The flows captured were not yet mapped to task types or offered on the graph; that is the step capture now leads to.

A commercialization process nobody had documented, mapped in seven conversations.
Supergoop, the fast-growing SPF skincare company, tracked tasks in a workflow tool, so each team knew its own assignments. Nobody held the whole process. Handoffs were inconsistent, responsibilities were unclear, and deadlines slipped without anyone seeing why. The usual answers were an external consultant or an offsite.
The goal it served
One commercialization process, agreed by every department and documented, within three weeks.
What was done
The Commercialization Manager ran seven one-hour conversations with stakeholders from each department over two and a half weeks, on Zoom, using the research-based discussion guides and recording into the platform. No system integration was needed to begin.
What came out
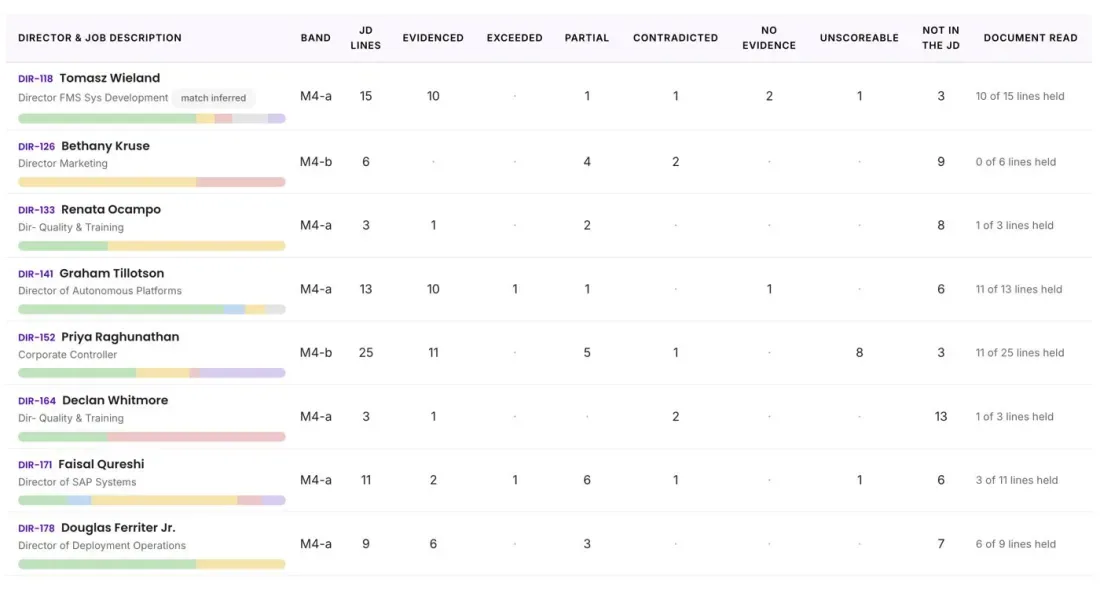
A step-by-step process overview with feedback from every department; checklists stating what each team does, when, for whom, and how it affects the others; RACI documents for each team; and a process map that showed the pain points and the places where departments disagreed about how the work ran.
Results
“Sugarwork filled a gap in our toolbox that workflow management tools don’t cover, with relatively low effort. The outputs were a game-changer, generating quickly what would have taken hours or days.”
Jeannie Barnes, Commercialization Manager, Supergoop
“We achieved in a fraction of the time and at a fraction of the cost everything we could have done with an external consultant. And we can use it for any process mapping and documentation on an as-needed basis.”
Ryan Crowley, CFO and COO, Supergoop
What this does not show
The outputs are a process map, checklists and RACIs: the process documented, not yet changed. Whether handoffs got faster afterwards was not measured, and the steps were not yet mapped to task types that logic, code, AI or a vendor could take.
A hundred senior leaders eligible to retire within two years. A consultancy that captured almost all of them.
A state government agency found that close to a hundred senior people could retire within eighteen to twenty-four months, taking decades of institutional memory and the context behind critical decisions with them. LCubed, the transformation consultancy brought in to respond, knew that note-taking and conventional process mapping would not reach it in time.
The goal it served
At least half of the hundred at-risk leaders interviewed in depth, inside the eighteen-to-twenty-four-month retirement window.
What was done
LCubed ran several hours of structured conversation with each at-risk person and used the platform to find the patterns, workflows and reasoning across them. The original scope was to interview half of the departing leaders. They interviewed almost all of them, at greater depth, within the same scope.
What came out
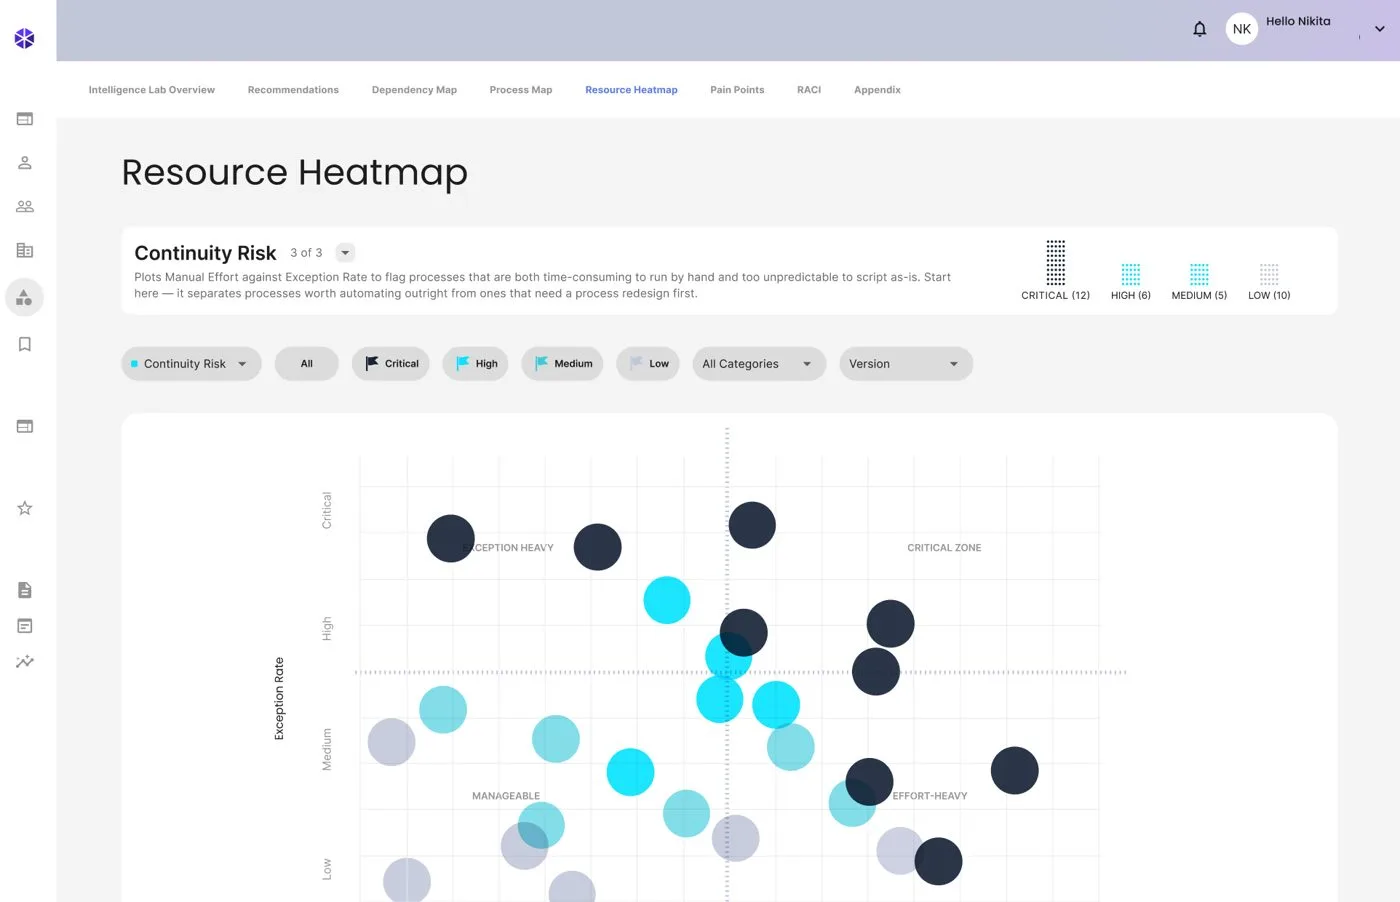
Around 250 detailed processes, plus the things process maps miss: unspoken flows, cross-functional frustrations, core values and motivators, and themes that spanned departments. The agency used it to quantify operational risk, confirm where the bottlenecks were, build a succession-planning framework, and feed a career development portal now in development.
Results
Figures as reported by LCubed.
“Our original scope was to interview 50 percent of the departing individuals. Instead, we were able to interview almost all of them, and at a much deeper level than traditional methods allow.”
Lisa L. Levy, Founder and CEO, LCubed
“We were able to capture not just what people did, but how they felt about their work, what motivated them, and what got in their way. This wasn’t just documentation. It was storytelling and strategy.”
Lisa L. Levy, Founder and CEO, LCubed
What this does not show
The processes and the reasoning behind them are captured. The succession framework and the career portal are the agency’s own work, and their results are not yet in. The 250 processes are captured as the agency runs them, not yet as task types on the rails.
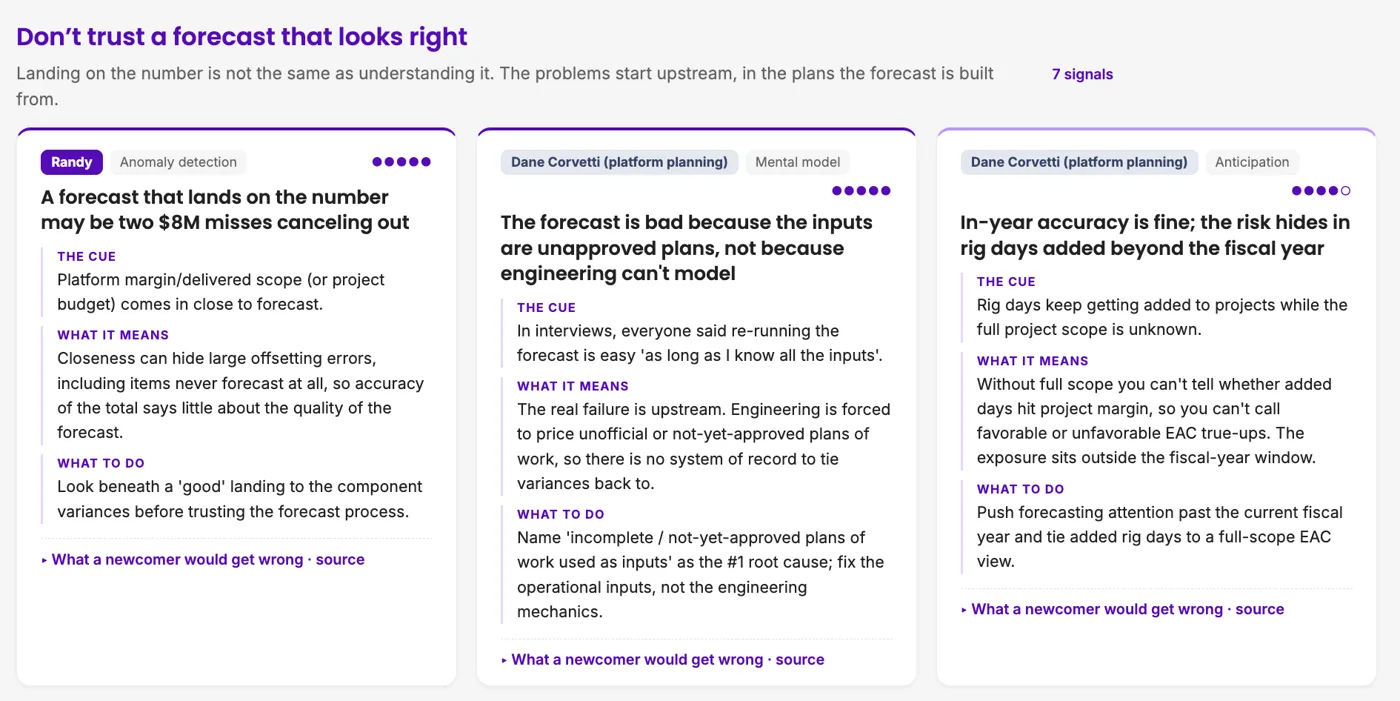
Capture alone doesn’t change the economics.
Recording the knowledge is the start. The flows have to become task types, mapped to Decidr’s ontology, and each task has to move to whoever does it best: conditional logic, code, AI, a named person, or a specialist vendor on the Decidr Graph. The Coordinate case studies show task types that have moved, and how much.